

Let’s have a look at the results for 2010 in this automated video message.
Once again we are trading the MACD signal with a risk setting of 5.
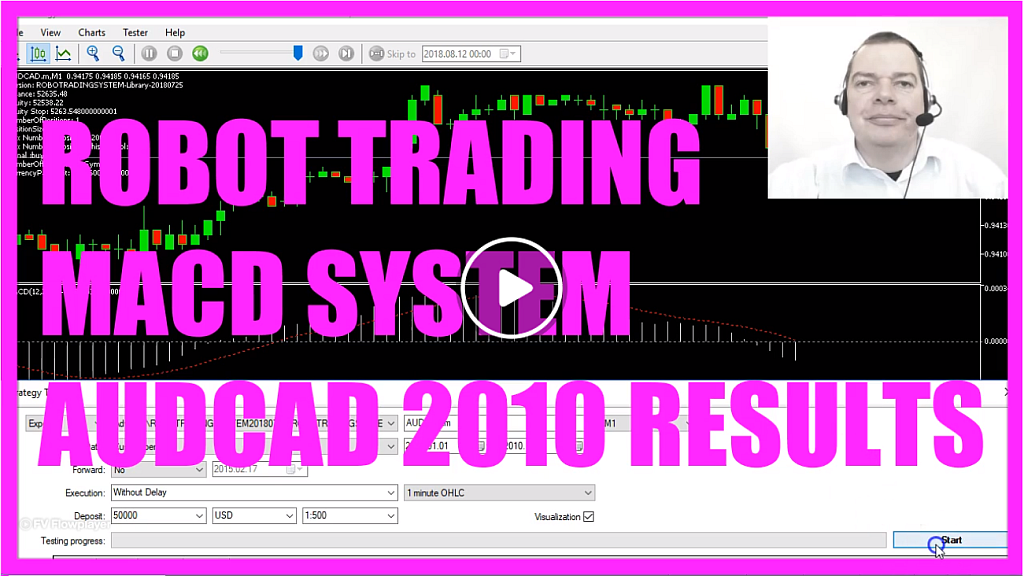
The MACD is an oscillator, the indicator is drawn below the candles and you see a red signal line that is switching between two extreme values.
We are using a very simple signal here, but there are several interpretations possible.
When the red line is below the zero line, we consider that to be a buy signal.
When the red line is above the zero line, we consider that to be a sell signal.
So the signal will switch, whenever the red line crosses the dotted line in the middle.
When you look at the chart, you will see that the signal output is always there.
It would also be possible to only generate signals when the line is crossed or when the highest or lowest value is reached.
You could add filters, combine the MACD with other signals or change the default values for this indicator.
But I am satisfied with the results as they are.
If you are interested in satisfying results, you might want to watch the other performance videos on RobotTradingSystem.com – or wherever you get your trading performance videos…
Download “MACD ROBOT TRADING SYSTEM DEMO VERSION - WORKS WITH AUDCAD ON DEMO ACCOUNTS ONLY”
MacDDemo.zip – Downloaded 1853 times – 70.97 KB