

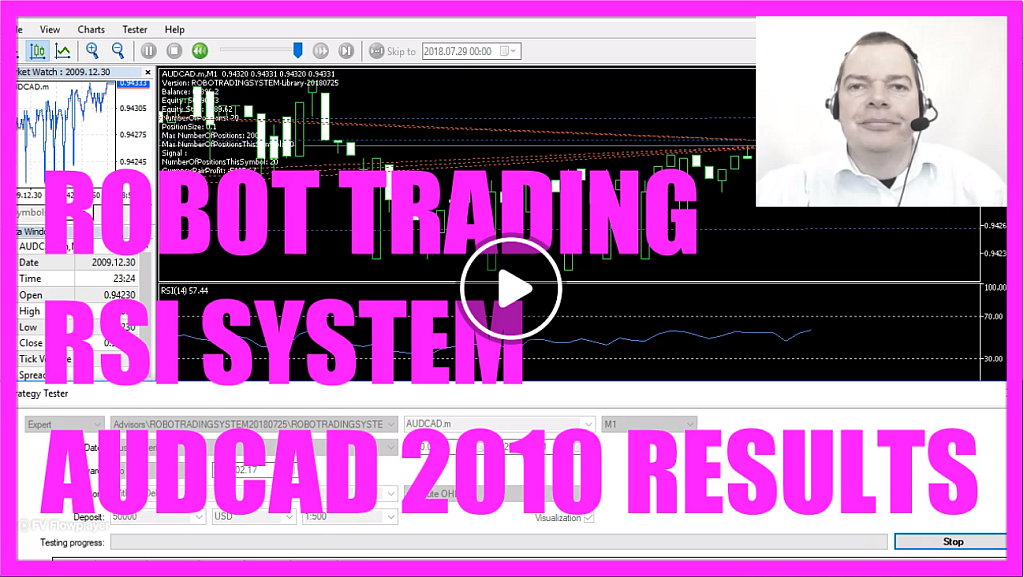
Let’s have a look at the RSI indicator for the year 2010 in this automated video message.
We are going to trade the australian dollar against the canadian dollar.
This time we use a risk setting of 5.
If you have a look on the chart, you will see, that the Balance and the Equity are calculated for each tick that comes in.
A tick is a price change and you need to decide what you want to do when the price changes and define what the automated system should do.
Humans do that based on emotions, because we are not so good at calculating to make a rational decision.
Your computer knows each and every price for all the candles on the chart and can make a rational decision in split seconds.
The best way to improve trading results is to use this huge speed advantage to do backtests – again and again – until you are satisfied with the results.
If you want to know more about backtest results, you maybe want to watch the other performance videos on RobotTradingTutorial.com – or wherever you get your trading performance videos…
Download “RSI ROBOT TRADING SYSTEM DEMO VERSION - WORKS WITH AUDCAD ON DEMO ACCOUNTS ONLY”
RSIDemo.zip – Downloaded 1799 times – 72.06 KB